Fused Fingerprints TMAP
Published:
This project implements a novel approach to visualizing chemical space using a combination of molecular fingerprints and the TMAP (Tree MAP) algorithm. The main goal is to create a meaningful representation of chemical compounds based on their structural similarities and biological activities.
Objectives:
- Visualization of Top Compounds: Identify and visualize the top 5 most active compounds for approximately 15,000 distinct biological targets.
- Fingerprint Merging and Minhashing: For each target, take 5 compounds and calculate their fingerprint using MAP*. These fingerprints, which encapsulate the chemical characteristics of each compound, are then merged to create a unified representation (merged_fp). Subsequently, the merged fingerprints are subjected to minhashing techniques to reduce dimensionality and facilitate efficient comparison (i.e. calculating Jaccard distances).
- Run TMAP
Key Components
1. Data Preparation and Analysis
The dataset contains information about chemical compounds, their targets, and various properties. It consists of 38,370 entries with 11 columns, including both categorical and numerical data. Data was selected to have the 5 most active compounds (canonical_smiles) for every Target_ID in the ChemBL database. The full dataset and code can be found here
Basic Information
- Total entries: 38,370
- Number of features: 11
Data Types and Missing Values
| Column | Data Type | Non-Null Count | Missing Values |
|---|---|---|---|
| canonical_smiles | object | 38370 | 0 |
| Target_ID | object | 38370 | 0 |
| target_name | object | 38370 | 0 |
| standard_type | object | 38370 | 0 |
| standard_relation | object | 38370 | 0 |
| standard_value | float64 | 38370 | 0 |
| standard_units | object | 38370 | 0 |
| target_protein_class | object | 24710 | 13660 |
| Target_Taxonomy | object | 38370 | 0 |
| Target_organism | object | 38370 | 0 |
| Target_type | object | 38370 | 0 |
Apparently almost 1/3 of the entries are missing the target_protein_class. Oh well, there’s not much we can do about it and also it is not that interesting so we will just let it be.
Unique Value Counts
| Column | Unique Values |
|---|---|
| canonical_smiles | 25860 |
| Target_ID | 7016 |
| target_name | 5697 |
| standard_type | 46 |
| standard_relation | 3 |
| standard_value | 6678 |
| standard_units | 2 |
| target_protein_class | 68 |
| Target_Taxonomy | 60 |
| Target_organism | 928 |
| Target_type | 20 |
Observations:
- Not every
canonical_smilesis unique, suggesting there are compounds that bind several Targets -which is expected-. - There are 7016 Targets.
- We will have to do reduce the unique values in some of the categories for the TMAP as color coding is not a good idea for <50 unique
- The numerical values like the IC50, Ki or Kd cannot be directly compared. We will use this when we display the merged compounds we will take the most active one of the 5 and show its IC50, molecule etc.
First Run using MAPC fingerprints
Running a First TMAP using MAP* fingerprints. Before fusing the fingerprints I want to make sure everything runs normally and visualize the TMAP with all the data available to then change necessary parameters.
Entire code here
- Import data
- Calculate fingerprints
- Run TMAP which includes:
- LSH Indexing and coordinates generation
- Coordinates and Layout configuration
- Plotting using Faerun
After a few trials and readjusting the node_size etc we have this: 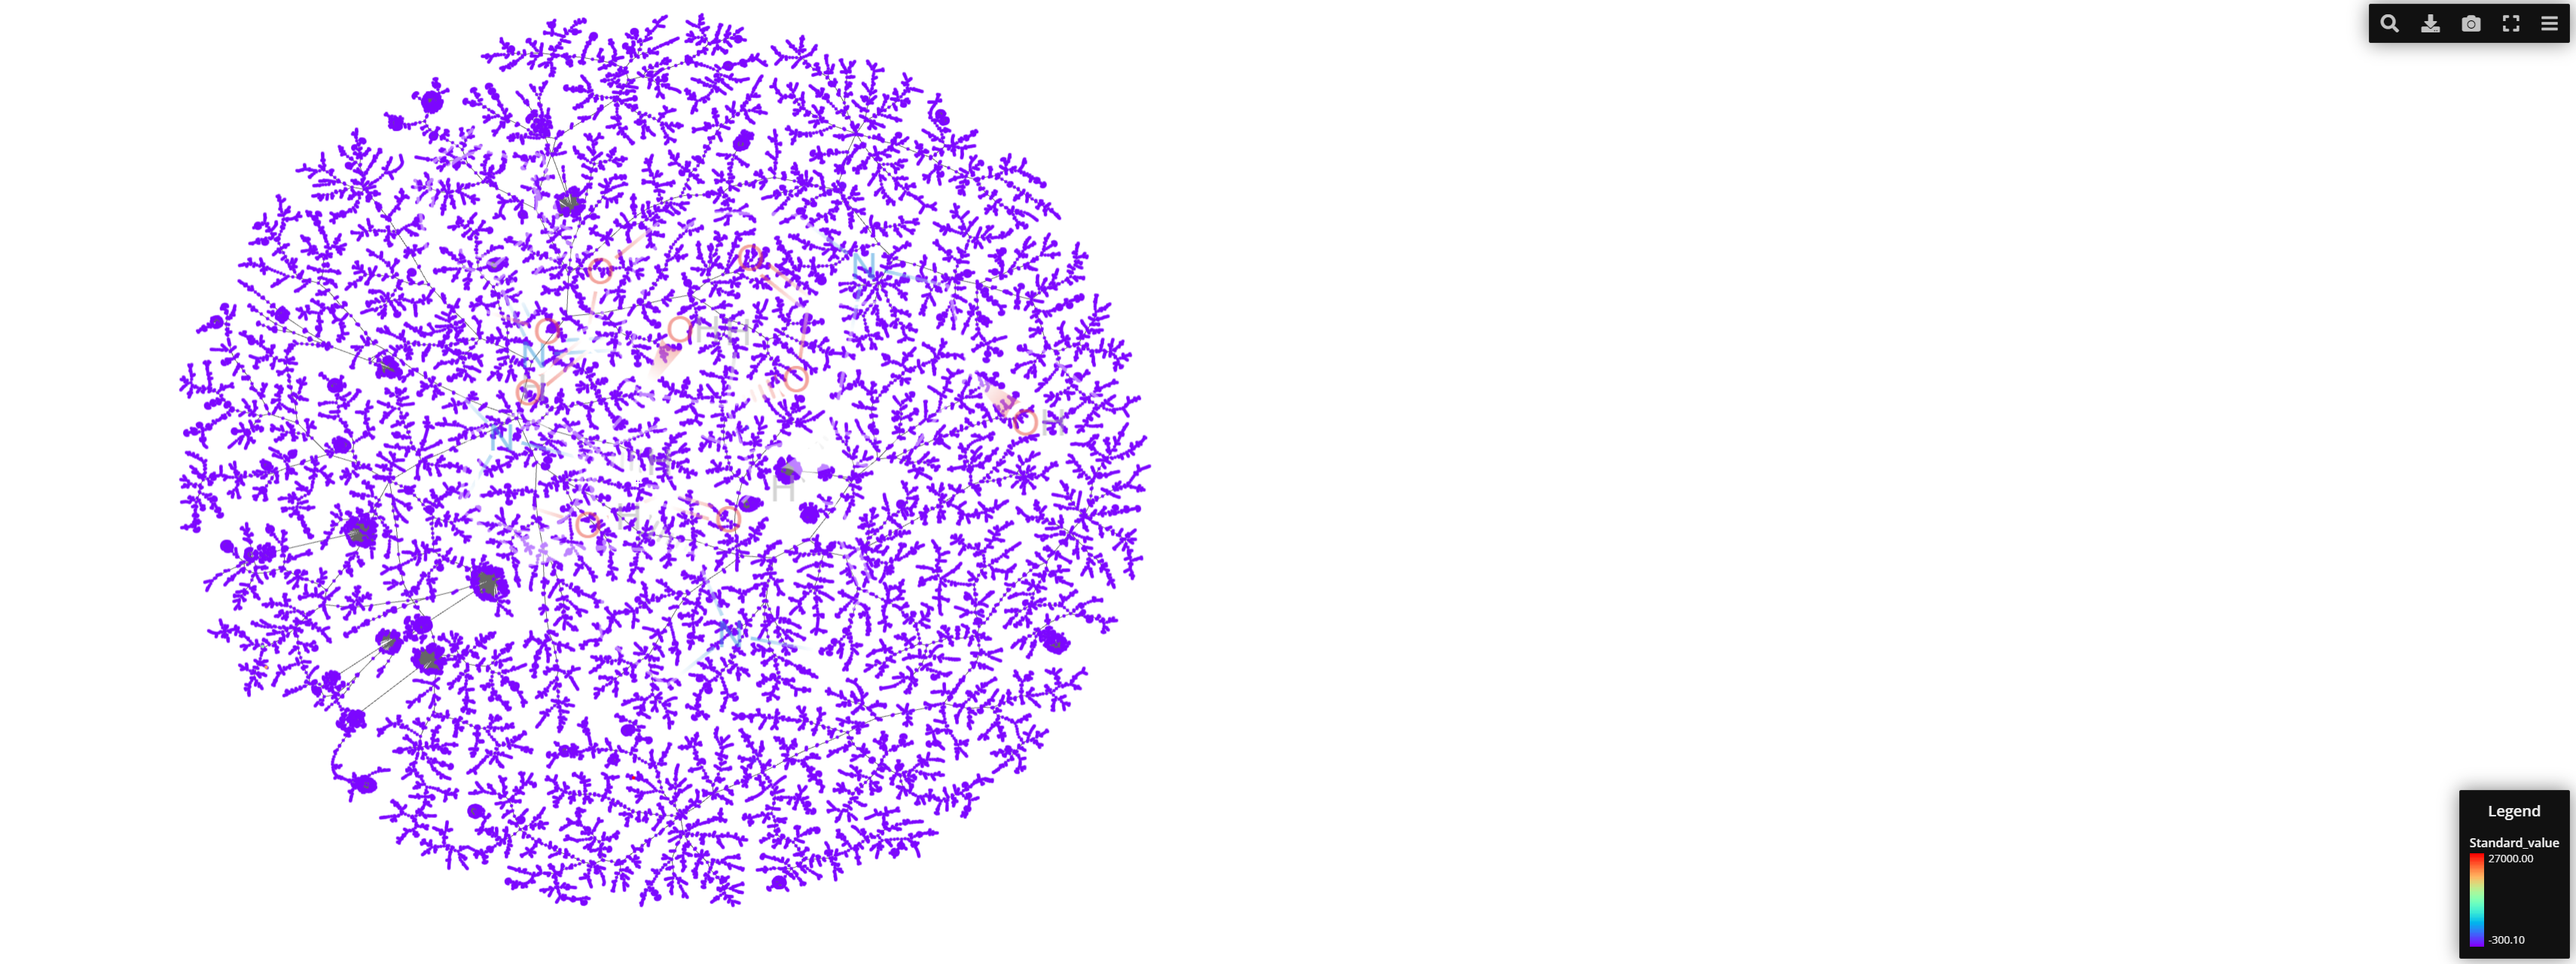
1.2. Data Mapping
Several mapping functions are used to categorize the data:
map_protein_class: Simplifies protein classes into broader categories.map_target_taxonomy: Categorizes target taxonomies.map_target_organism: Groups target organisms into higher-level categories.
These mappings help in creating meaningful color schemes in the final visualization.
1.3. Selecting data to displayed after Merging
After the merging is done we will end up with only 1 point per target. Which means that if we want to display some information about the compound that is binding the target, we will have to select the data from 1 of the 5 compounds per target. Combining or averaging the data for the 5 compounds is really not worth doing, so we will only select the data -and use it for display in our TMAP- from the most active compound.
For that we use select_value function identifies the most active compound for each group of data based on the 'standard_type' and 'standard_value' columns.
It selects either the maximum or minimum 'standard_value' based on the type of activity indicated by 'standard_type'. For activity types like Activity, Inhibition, Potency, % Inhibition, and Percent Effect, a higher value is preferred. For all other types, a lower value is selected.
2. Fingerprint Generation
Two types of molecular fingerprints are supported:
- MHFP (MinHash Fingerprint): A probabilistic fingerprint based on the circular fingerprint algorithm.
- MAPC (MapChiral): A fingerprint that takes into account the chirality of molecules.
The encode_smiles function is responsible for generating these fingerprints from SMILES strings.
I spent some time optimizing the computation of fingerprints to reduce the overall runtime. Initially, the code would take about 13.5 minutes to execute from start to finish. This meant that any time I wanted to make a small change—like adjusting the layout or background color—I had to wait almost 14 minutes just to see the results. To avoid this, I focused on saving the computed fingerprints once and reusing them, rather than recalculating them each time. This optimization reduced the runtime from nearly 14 minutes to under 1 minute. In other words, I saved almost an hour for every four design tweaks I wanted to make, such as changing labels, layout, or sizes. It was definitely worth the effort.
Here’s the code that made this possible:
# Define the path for saving/loading fingerprints
fingerprints_file = Path(r'C:\Users\...\fused_fingerprints.pkl')

if fingerprints_file.exists():
    logger.info('Loading pre-calculated fingerprints')
    with open(fingerprints_file, 'rb') as f:
        data = pickle.load(f)
    fused_fingerprints = data['fused_fingerprints']
    logger.info(f'Total fused fingerprints: {len(fused_fingerprints)}')
    valid_indices = data['valid_indices']

else:
    logger.info('Calculating fingerprints')
    # Calculate fingerprints
    fingerprints, valid_indices = calculate_fingerprints(df, 'mapc')
    # Combine fingerprints
    logger.info('Combining fingerprints')
    fused_fingerprints = minhash_fingerprints(df, fingerprints, valid_indices)
    fused_fingerprints = fused_fingerprints.apply(list_to_vectorUint)
    logger.info(f'Combination successful. Total fused fingerprints: {len(fused_fingerprints)}')

    # Save the calculated fingerprints and valid_indices
    with open(fingerprints_file, 'wb') as f:
        pickle.dump({
            'fused_fingerprints': [list(fp) for fp in fused_fingerprints],
            'valid_indices': valid_indices
        }, f)
    logger.info('Saved calculated fingerprints for future use')
3. Merging the Fingerprints
One of the unique aspects of this project is the fusion of fingerprints for compounds targeting the same protein. This is done using the minhash_fingerprints function, which combines fingerprints by taking the minimum values for identical targets. This approach allows us to represent a group of compounds (targeting the same protein) as a single point in our visualization
Understanding Fingerprints
A fingerprint is essentially a vector of n-dimensions. It can be binary or an array of integers. In TMAP, the vector object (or fingerprint) used is not a standard numpy array, but a special type called VectorUint. For our purposes, we can think of it as a normal array.
The Merging Process
To merge the fingerprints, we select the minimum value at each index for all the fingerprints with the same target ID. The resulting vector will have a combination of all the vectors (fingerprints) from the different compounds and therefore will encode the most relevant features.
Here’s a step-by-step breakdown of the process:
- Convert to numpy arrays: To perform the minimum value operation provided by numpy, we first need to convert the TMAP
VectorUintobjects into numpy arrays. This is done becauseVectorUintdoesn’t support numpy calculations directly.df_processed = df.loc[valid_indices].copy() df_processed['fingerprint_vector'] = pd.Series(fingerprints, index=valid_indices) df_processed['fingerprint_vector'] = df_processed['fingerprint_vector'].apply(np.array) - Merge fingerprints: We then calculate the resulting vector by merging (selecting the minimum value at each index):
result = df_processed.groupby('Target_ID').agg({
        'fingerprint_vector': lambda x: np.min(np.vstack(x), axis=0).tolist(),
        **{col: 'first' for col in df_processed.columns if col not in ['fingerprint_vector', 'Target_ID']}
    }).reset_index(
Let’s break down this operation: - df_processed.groupby('Target_ID'): This groups all compounds by their target ID. - lambda x: np.min(np.vstack(x), axis=0): For each group, this function: - Stacks all fingerprint vectors vertically (np.vstack(x)) - Finds the minimum value along each column (axis=0) - .tolist(): Converts the resulting numpy array back to a list. - The **{col: 'first' for ...} part ensures we keep other relevant columns, taking the first value for each group.
Practical Example
Let’s consider a simplified example with 2-dimensional fingerprints: Suppose we have three compounds targeting the same protein:
- Compound A: [11, 4, 12, 10, 4]
- Compound B: [2, 3, 9, 7, 4]
- Compound C: [3, 1, 22, 13, 2]
Our merging process would work by 1. stacking the vectors:
[11, 4, 12, 10, 4]
[2, 3, 9, 7, 4]
[3, 1, 22, 13, 2]
Then 2. taking the minimum value in each column.
This final vector [3, 1, 9, 7, 2] now represents all three compounds targeting this specific protein. It captures the most conservative estimate of each feature across all compounds, potentially highlighting the most crucial structural elements shared among them.
By using this merging technique, we create a more condensed representation of the chemical space, where each point represents not just a single compound, but a group of compounds sharing the same target.
4. TMAP Generation
The TMAP algorithm is used to create a layout for our data points. This involves several steps:
- Creating an LSH (Locality-Sensitive Hashing) Forest for efficient nearest neighbor search.
- Indexing the fused fingerprints.
- Generating a layout using the
layout_from_lsh_forestfunction.
5. Visualization with Faerun
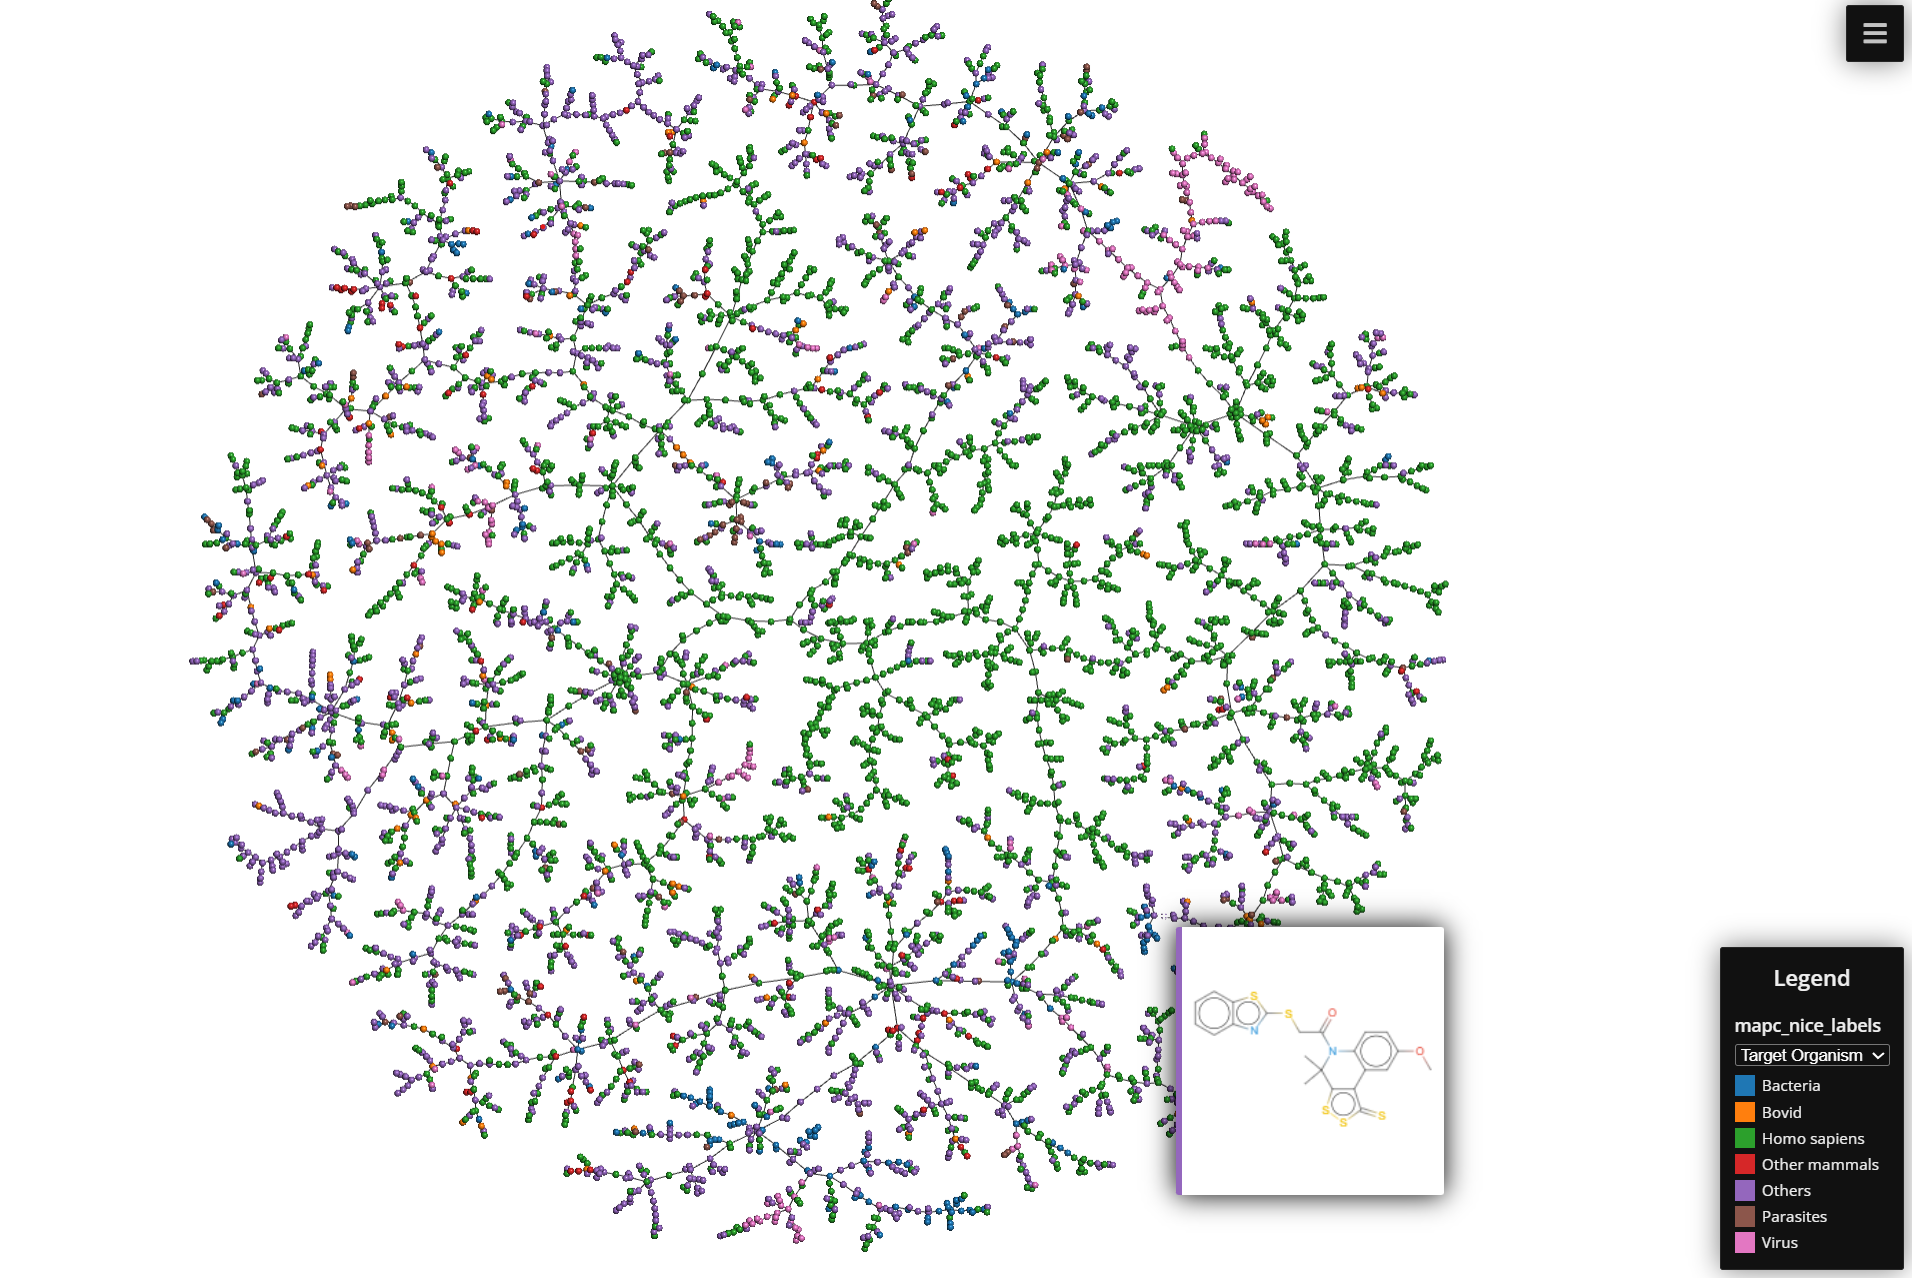
The final step is to visualize the data using the Faerun library, which is specially designed for large-scale chemical space visualization. The plot_faerun function handles this process, creating an interactive scatter plot where:
- Each point represents a group of compounds targeting the same protein.
- Colors represent different categories (protein class, target taxonomy, target organism).
- Hovering over a point shows the SMILES string and a link to the target’s ChEMBL page.
- A tree structure shows the relationships between data points.
Final result: