
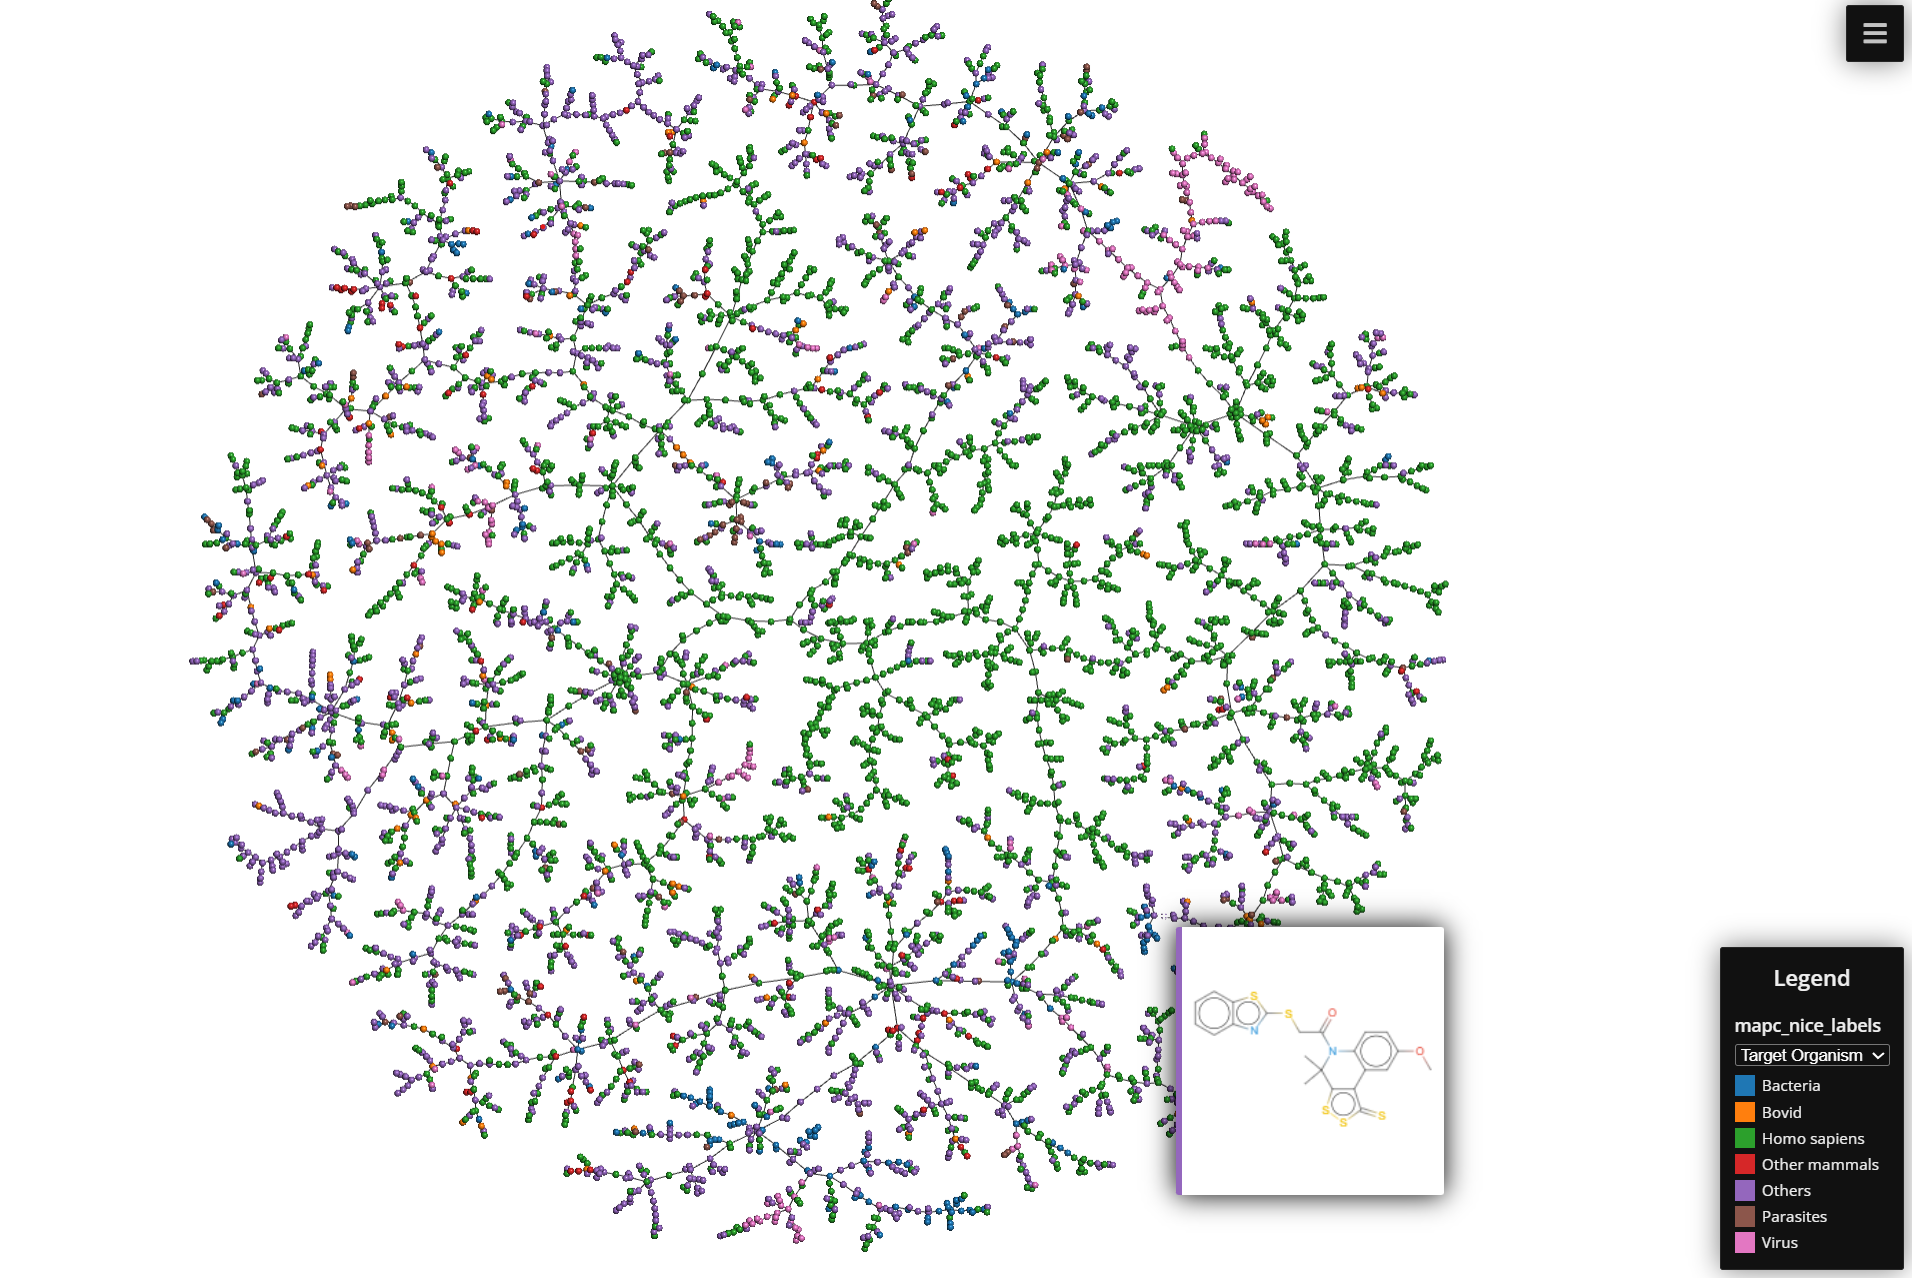
TMAP
Published:
The general process of TMAP looks like this:
1. Generate Fingerprints:
The process starts with generating 512-bit fingerprints for each molecule or data point. These fingerprints are binary vectors that represent the features or characteristics of the molecules
2. Min-Hashing:
TMAP employs MinHashing, which is better suited for comparing Jaccard similarity between sets, particularly for molecular fingerprints represented as binary vectors (presence/absence of molecular features). The main objective of MinHashing is reduce the dimensionality of the fingerprints while preserving similar information.
You can find more about what MinHashing is and how does it work in the dedicated blog post for it here
In essence:
- Apply multiple hash functions to the fingerprints bits
- For hash function, keep only the minimum hash value
- The resulting set of minimum hash values becomes the MinHash signature. This step reduces the 512-bit vectors to a smaller set of integers (e.g. 128)
3. LSH Forest
LSH Forest is used for efficient approximate nearest neighbour search in high-dimensional spaces. It’s particularly useful in the context of tmap because it allows for quick similarity searches among a large number of molecular fingerprints. In essence:
- Create multiple LSH tables, each using a subset of the MinHash signature.
- Each table is structured as a prefix tree (trie) for quick lookup.
- When querying, traverse the trees to find candidate nearest neighbors. This structure allows for fast retrieval of similar items without exhaustive search.
For a more detailed explanation of LSH Forest and how it works see the dedicated post here:
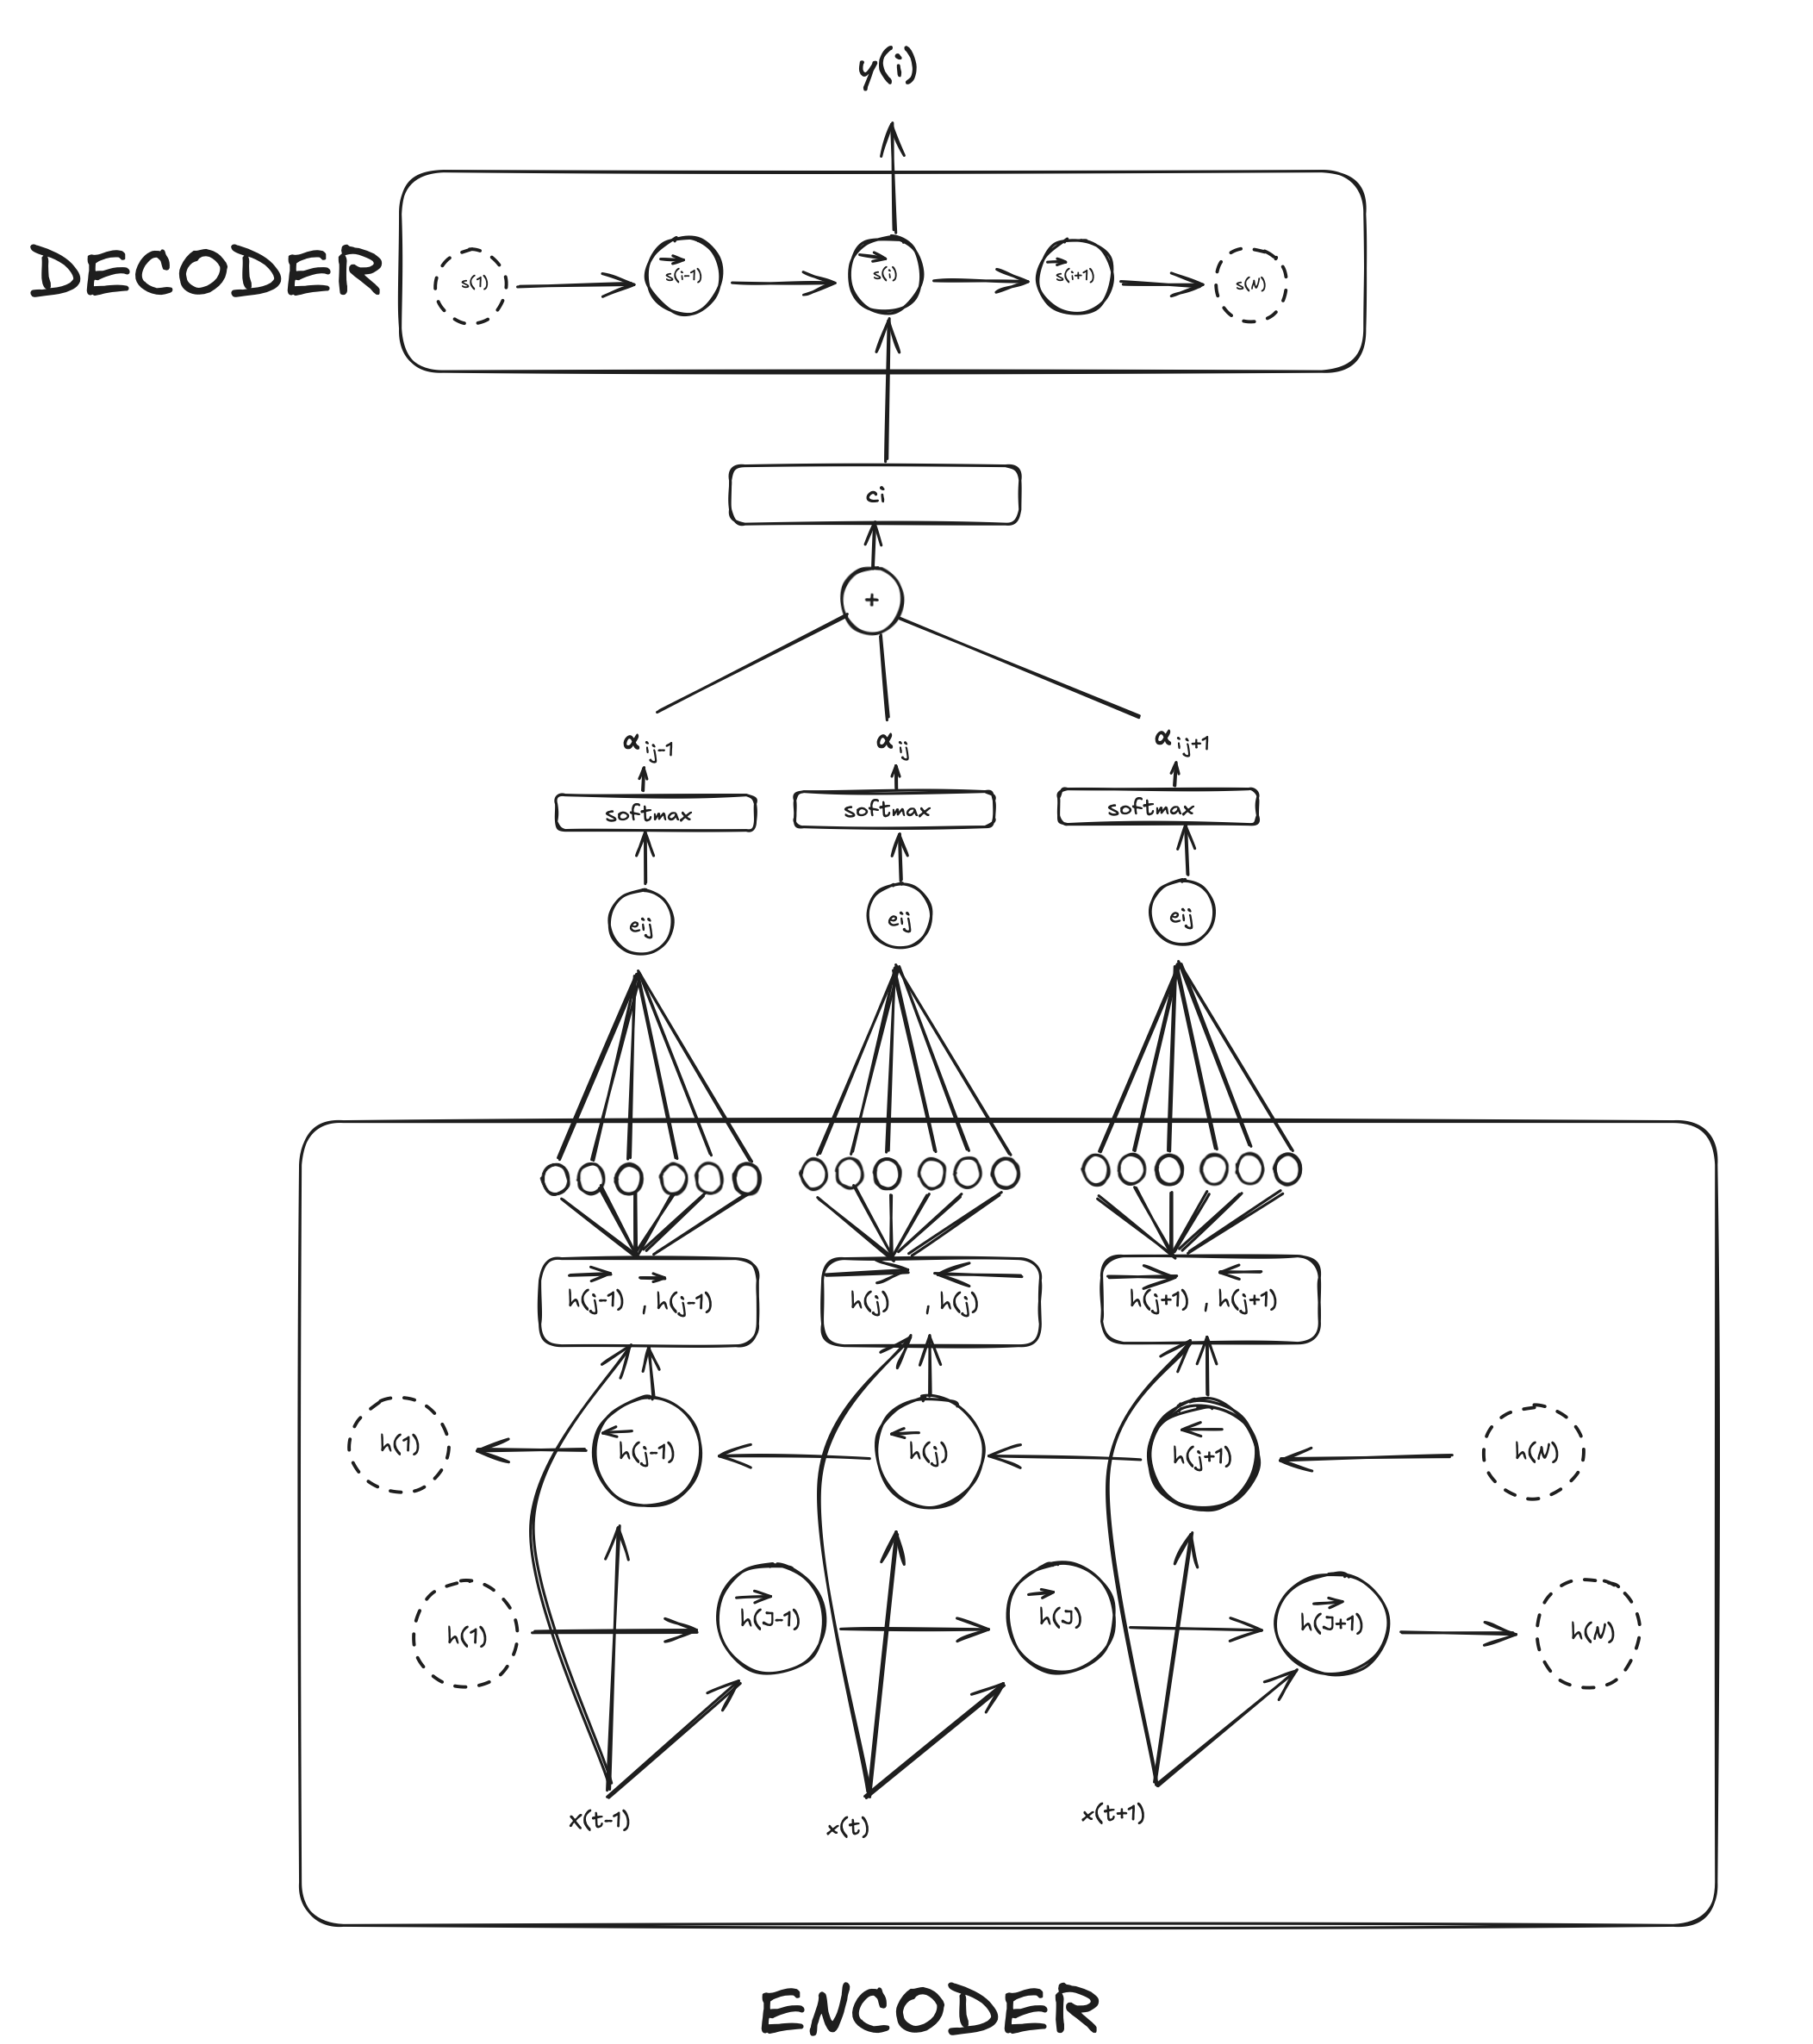
4. k-NN Graph (k-Nearest Neighbours Graph):
Using the LSH Forest, construct a k-NN graph:
- For each data point, find its k nearest neighbours using the LSH Forest.
- Create edges between each point and its k nearest neighbors.
- The result is a graph where each node is connected to its most similar neighbours.
*For a more detailed explanation of k-NN Graph and how it works see the dedicated post here
5. Minimum Spanning Tree from the k-NN
The MST, or Minimum Spanning Tree, is a graph that connects all data points in a way that minimizes the total edge weight. In this step, the algorithm constructs an MST based on the c-approximate k-NNs obtained in the previous step. The MST helps capture the global structure and relationships among data points. The algorith used for MST is Kruskal’s algorithm. A greedy algorithm beacuse it makes locally optimal choices at each step (i.e., selecting the minimum-weight edge) with the hope of finding a globally optimal solution (the MST).
6. Generating the Layout in 2D Space
Once the MST is constructed, the next step is to generate a 2D layout for visualization.
- TMAP uses a force-directed layout algorithm to place the nodes (molecules) in 2D space.
- Repulsion: Each node repels all other nodes, like electric charges repelling each other. This ensures that nodes are not all clustered in one spot.
- Attraction: The edges between nodes (based on their similarity) act like springs. If two nodes are highly similar (high Jaccard similarity, low distance), the “spring” pulls them closer together. If they are dissimilar, they are pushed farther apart.
- As the algorithm iterates, the nodes settle into positions where:
- Highly similar molecules (those with higher Jaccard similarity) end up closer together in the layout.
- Dissimilar molecules are positioned further apart.
7. Final Visualization:
The result is a 2D layout can be seen in a html file that retrieves information from a .js file.
Other Useful things to know
Use different descriptors/fingerprints
The descriptors/fingerprints need to be converted to Minhash vectors first. It supports binary, indexed, string and also int and float weighted vectors as input and returns a list of Minhash vectors (List of VectorUint)
Methods for different types of input:
batch_from_binary_array. MinHash vectors from binary arrays. The input vectors need to be a list of VectorUchar.
batch_from_int_weight_array. Create MinHash vectors from integer arrays (not only zeros and ones). The input vectors need to be a list of VectorUint.
batch_from_sparse_binary_array. Create MinHash vectors from sparse binary arrays. The input vectors need to be a list of VectorUint – A list of vectors containing indices of ones in a binary array.
batch_from_string_array. Create MinHash vectors from string arrays. The input vector is a list of list or string.
batch_from_weight_array. Create MinHash vectors from float arrays. The input vectors need to be a list of VectorFloat. – A list of vectors containing float values. Keyword Arguments: method (str) – The weighted hashing method to use (ICWS (default) or I2CWS).
Example of TMAP
from mhfp.encoder import MHFPEncoder
from mhfp.lsh_forest import LSHForestHelper

#xinhao example
perm = 512
enc = MHFPEncoder(perm)
fingerprints = [tm.VectorUint(enc.encode(s)) for s in df['molecules'

lf = tm.LSHForest(perm)

# Add the Fingerprints to the LSH Forest and index lf.batch_add(fingerprints)
lf.index()

cfg = tm.LayoutConfiguration() #configuration parameters for tmap layout cfg.node_size = 1 / 26 #size of nodes which affects the magnitude of their repelling force. Decreasing this values generally resolves overlaps in a very crowded tree

cfg.mmm_repeats = 2 #number of repeats of the per-level layout algorithm

cfg.sl_extra_scaling_steps = 10 #sets the number of repeats of the scaling

cfg.k = 20 #number of nearest neighbours used to create the k-nearest neighbour graph

cfg.sl_scaling_type = tm.RelativeToAvgLength #Defines the relative scale of the graph

x, y, s, t, _ = tm.layout_from_lsh_forest(lf, cfg)

set1 = plt.get_cmap("Set1").colors

bin_cmap = ListedColormap(["#DC267F", "#648FFF"], name="bin_cmap")

f = Faerun(
	view="front", coords=False, title="", clear_color="#FFFFFF",
	)

f.add_scatter(
	"GDB13S_vs_USPTO_TMAP", { "x": x, "y": y, "c": [ df['labels'].values.tolist(), ], "labels": df['molecules'].values.tolist(), }, shader="smoothCircle", point_scale=5, max_point_size=20, legend_labels=[None], categorical=[True], colormap=[bin_cmap], series_title=['Jaccard distance'], has_legend=True, )

f.add_tree("GDB13S_vs_USPTO_TMAP_tree", {"from": s, "to": t}, point_helper="GDB13S_vs_USPTO_TMAP")
f.plot('GDB13S_vs_USPTO_TMAP', template='smiles')
Comments